4. The human auditory system
4.1 Ear anatomy
The human auditory system is a real wonder - with two compact auditive sensor organs - the ears - at either side of the head, connected with a string of high speed nerve fibres to the brain stem. The brain stem is the central connecting point of the brain - connecting the human body’s nervous system inputs (such as audio, vision) and outputs (such as muscle control) to the other areas of the brain. The brain stem redirects the audio information from the ears to a section of the brain that is specialised in audio processing: the auditory cortex.
This chapter consists of three parts: the ear anatomy - describing in particular the inner ear structure, the audio universe - presenting the limitations of the human auditory system in three dimensions, and auditory functions - describing how our auditory cortex interprets the audio information coming from the ears. The ear anatomy and the auditory functions are presented using very simplified models - only describing the rough basics of the human auditory system. For more detailed and accurate information, a list of information sources for further reading is suggested in appendix.
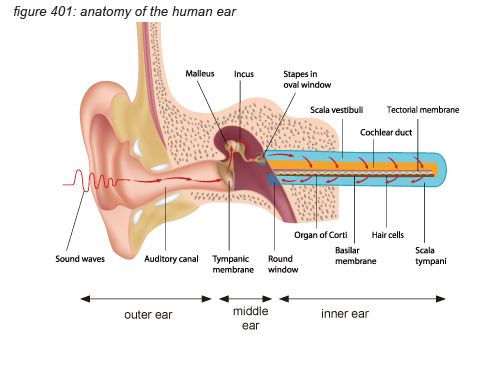
The ear can be seen as three parts: the outer ear, the middle ear and the inner ear - each with a dedicated function.
The outer ear consists of the ear shell (pinna) and the auditory canal. Its function is to guide air pressure waves to the middle ear- with the ear shell increasing the sensitivity of the ear to the front side of the head, supporting front/rear localisation of audio signals.
The middle ear consists of the ear drum (tympanic membrane), attached to the inner ear through a delicate bone structure (malleus, incus and stapes). The middle ear bones (ossicles) and the muscles keeping them in place are the smallest in the human body. One of the major functions of the middle ear is to ensure the efficient transfer of sound from the air to the fluids in the inner ear. If the sound were to impinge directly onto the inner ear, most of it would simply be reflected back because acoustical impedance of the air is different from that of the fluids. The middle ear acts as an impedance-matching device that improves sound transmission, reduces the amount of reflect sound and protects the inner ear from excessive sound pressure levels. This protection is actively regulated by the brain using the middle ear’s muscles to tense and un-tense the bone structure with a reaction speed as fast as 10 milliseconds. The middle ear’s connection to the inner ear uses the smallest bone in the human body: the stapes (or stirrup bone), approximately 3 millimetres long, weighing approximately 3 milligrams.
The inner ear consists of the cochlea - basically a rolled-up tube. The middle ear’s stapes connects to the cochlea’s ‘oval window’. The rolled-up tube contains a tuned membrane populated with approximately 15,500 hair cells and is dedicated to hearing. The structure also has a set of semi-circular canals that is dedicated to the sense of balance. Although the semi-circular canal system also uses hair cells to provide the brain with body balance information, it has nothing to do with audio.
For audio professionals, the cochlea is one of the most amazing organs in the human body, as it basically constitutes a very sensitive 3,500-band frequency analyser with digital outputs - more or less equivalent to a high resolution FFT analyzer.
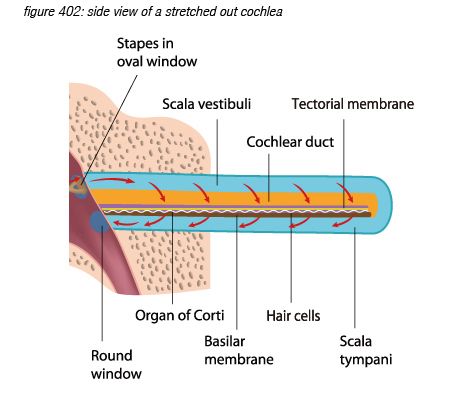
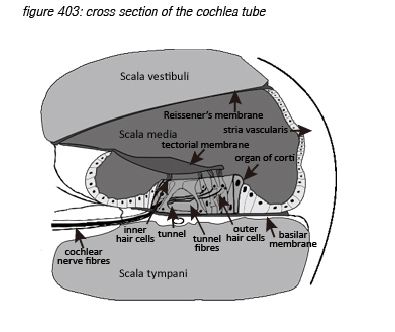
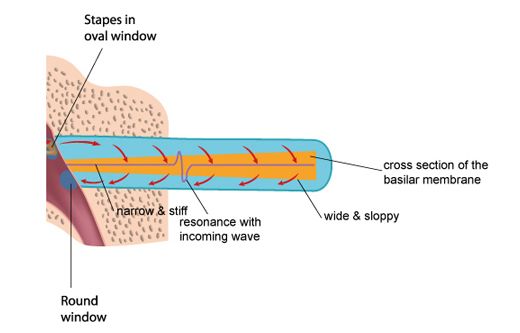
Unrolling and stretching-out the cochlea would give a thin tube of about 3.4 centimetres length, with three cavities (scala vestibuli, and scala timpani, filled with perilymph fluid, and scala media, filled with endolymph fluid), separated by two membranes: the Reissner’s membrane and the basilar membrane. The basilar membrane has a crucial function: it is thin and stiff at the beginning, and wide and sloppy at the end - populated with approximately 3,500 sections of 4 hair cells.
Incoming pressure waves - delivered to the cochlear fluid by the stapes - cause mechanical resonances on different locations along the basilar membrane, tuned to 20 kHz at the beginning near the oval window - where the membrane is narrow and stiff, down to 20 Hz at the end where the membrane is wide and sloppy.
A row of approximately 3,500 inner hair cells (IHC’s) are situated along the basilar membrane, picking up the resonances generated by the incoming waves. The inner hair cells are spread out exponentially over the 3.4 centimetre length of the tube - with many more hair cells at the beginning (high frequencies) than at the end (low frequencies). Each inner hair cell picks up the vibrations of the membrane at a particular point - thus tuned to a particular frequency. The ‘highest’ hair cell is at 20 kHz, the ‘lowest’ at 20 Hz - with a very steep tuning curve at high frequencies, rejecting any frequency above 20 kHz. (more on hair cells on the next page)
Roughly in parallel with the row of 3,500 inner hair cells, three rows of outer hair cells (OHC’s) are situated along the same membrane. The main function of the inner hair cells is to pick up the membrane’s vibrations (like a microphone). The main function of the outer hair cells is to feed back mechanical energy to the membrane in order to amplify the resonance peaks, actively increasing the system’s sensitivity by up to 60dB(*4C).
Hair cells are connected to the brain’s central connection point - the brain stem - with a nerve string containing approximately 30,000 neurons (axons)(*4D). Neurons that transport information from a hair cell to the brain stem are called afferent neurons (or sensory neurons). Neurons that transport information from the brain stem back to (outer) hair cells are called efferent neurons (or motor neurons). Afferent and efferent connections to outer hair cells use a one-to-many topology, connecting many hair cells to the brain stem with one neuron. Afferent connections to inner hair cells (the ‘microphones’) use a many-to-one topology for hair cells tuned to high frequencies, connecting one hair cell to the brain stem with many neurons.
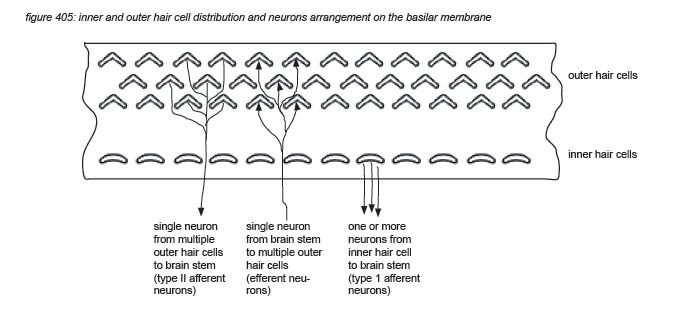
Zooming in to the hair cell brings us deeper in the field of neurosciences. Inner hair cells have approximately 40 hairs (stereocilia) arranged in a U shape, while outer hair cells have approximately 150 hairs arranged in a V or W shape(*4E) . The hair cells hairs float free in the cochlea liquid (endolymph) just below the tectorial membrane hovering in the liquid above them, with the tips of the largest outer hair cells’ hairs just touching it.
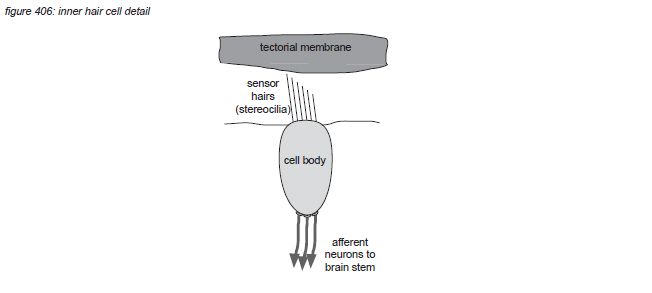
When the basilar membrane below the hair cell moves, the hairs brush against the tectorial membrane and bend - causing a bio-electrical process in the hair cell. This process causes neural nerve impulses (action potentials, a voltage peak of approximately 150 millivolts) to be emitted through the afferent neuron(s) that connect the hair cell to the brain stem. The nerve impulse density (the amount of nerve impulses per second) depends on how much the hairs are agitated. When there’s no vibration on a particular position on the basilar membrane, the corresponding hair cell transmits a certain amount of nerve impulses per second. When the vibration of the basilar membrane causes the hairs to bend back (excitation) and forth (inhibition), the density of nerve impulses will increase and decrease depending on the amplitude of the vibration.
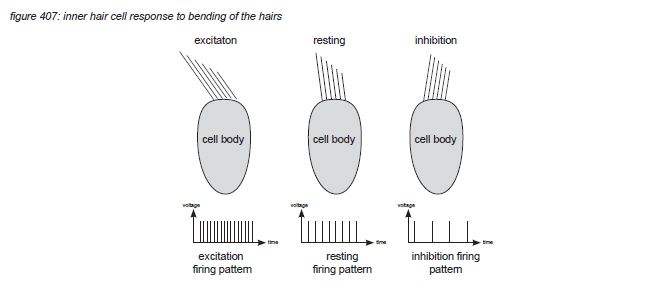
The maximum firing rate that can be transported by the neurons attached to the hair cell is reported to be up to 600 nerve impulses (spikes) per second. The nerve string from the cochlea to the brain contains approximately 30,000 auditory nerve fibres - of which more than 95% are thought to be afferent - carrying information from hair cells to the brain stem(*4F). The brainstem thus receives up to 18 million nerve impulses per second, with the spike density carrying information about the amplitude of each individual hair cell’s frequency band, and the spike timing pattern carrying information about time and phase coherency. As the human auditory system has two ears, it is the brain’s task to interpret two of these information streams in real time.

4.2 The audio universe
The sensitivity of the human auditory system has been measured for individual frequencies in many research projects, accumulating in the ISO226:2003 ‘loudness contour’ standard(*4G). This sensitivity measurement includes the outer/middle/inner ear and the route from the cochlea via the auditive cortex to the higher brain functions that allow us to report the heard signal to the researcher. The ISO226:2003 graph shows equal perceived loudness (‘phon’) in the frequency domain for different sound pressure levels for the average human - the actual values can vary by several dB’s. The lowest line in the graph is the hearing threshold - with the approximate sound pressure level of 20 micro Pascal at 1kHz to be used as the SPL reference point of 0dBSPL.
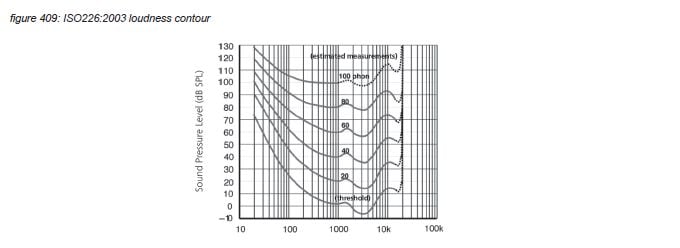
The ISO226 contour graph shows a maximum sensitivity around 3 kHz - covering the most important frequencies used in human speech. Above 20 kHz the basilar membrane doesn’t resonate, and there are no hair cells to pick up any energy - limiting human hearing to 20 kHz with a very steep slope. Below 20 Hz, hair cells at the end of the basilar membrane can still pick up energy - but the sensitivity is very low.
At a certain sound pressure level, the hair cells become agitated above their maximum range, causing pain sensations. If hair cells are exposed to high sound pressure levels for long times, or to extremely high sound pressure level for a short-period (so the middle ear’s sensitivity can not be adjusted in time), hairs will damage or even break off. This causes inabilities to hear certain frequencies - often in the most sensitive range around 3 kHz. With increasing age, hair cells at the high-end of the audio spectrum - having endured the most energy exposure because they are at the beginning of the basilar membrane - will die, causing age-related high frequency hearing loss. Sometimes, when hair cells are damaged by excessive sound pressure levels, the disturbed feedback system causes energy detection even without any audio signal - often a single band of noise at constant volume (tinitis)(*4H).
Damaged hair cells can not grow back, so it is very important to protect the ears from excessive sound pressure levels. The European Parliament health and safety directive 2003/10/EC and the ISO 1999:1990 standard state an exposure limit of 140dBSPL(A) peak level exposure and a maximum of 87dBSPL(A) for a daily 8 hours average exposure(*4I).
In many research projects, a pain sensation is reported around 120dBSPL exposure, to be almost constant along the frequency spectrum(*4J). Although sound quality requirements differ from individual to individual, in this white paper we will assume that ‘not inflicting pain’ is a general requirement for audio signals shared by the majority of sound engineers and audiences. Therefore we will arbitrarily set the upper limit of sound pressure level exposure at 120dBSPL. (note that this is the SPL at the listeners position, not the SPL at 1 meter from a loudspeaker’s cone - this level needs to be much higher to deliver the required SPL over long distances).
For continuous audio signals, the described level and frequency limits apply in full. But most audio signals are not continuous - when examined in the frequency domain, each frequency component in the audio signal changes over time. For frequencies under 1500 Hz, the hair cells on the membrane can fire nerve impulses fast enough to follow the positive half of the waveform of the vibration of the basilar membrane - providing continuous information of the frequency component’s level envelope and relative phase. For higher frequencies, the vibrations go too fast for the hair cell to follow the waveform continuously - explaining that for continuous signals humans can hardly detect relative phase for high frequencies.
If there would be only one hair cell connected to the brain with only one neuron, the maximum time/phase detection would be the reciprocal of the neuron’s thought maximum firing rate of 600 Hz, which is 1667 microseconds. But the cochlear nerve string includes as much as 30,000 afferent neurons, their combined firing rate theoretically could reach up to 18 MHz - with a corresponding theoretical time/phase detection threshold of 0.055 microseconds. Based on this thought, the human auditory system’s time/phase sensitivity could be anywhere between 0.055 and 1667 microseconds. To find out exactly, Dr. Milind N. Kunchur from the department of physics and astronomy of the university of South Carolina performed a clinical experiment in 2007, playing a 7kHz square wave signal simultaneously through two identical high quality loudspeakers(*4K). The frequency of 7kHz was selected to rule out any audible comb filtering: the first harmonic of a square wave is at 3 times the fundamental frequency, in this case at 21kHz - above the frequency limit, so only the 7 kHz fundamental could be heard with minimum comb filtering attenuation. First the loudspeakers were placed at the same distance from the listener, and then one of the loudspeakers was positioned an exact amount of millimetres closer to the listener - asking the listener if he or she could detect the difference (without telling the distance - it was a blind test). The outcome of the experiment indicated that the threshold of the perception of timing difference between the two signals was 6 microseconds. A later experiment in 2008 confirmed this value to be even a little lower. In this white paper we propose 6 microseconds to be the timing limitation of the human auditory system. Note that the reciprocal of 6 microseconds is 166kHz - indicating that an audio system should be able to process this frequency to satisfy this timing perception - a frequency higher than the frequency limit of the cochlea. Kunchur identified the loudspeaker’s high frequency driver as the bottleneck in his system, having to make modifications to the loudspeakers to avoid ‘time smearing’. More on the timing demands for audio systems is presented in chapter 6.
The maximum time that humans can remember detailed audio signals in their short term aural activity image memory (echoic memory) is reported to be 20 seconds by Georg Sperling(*4L).
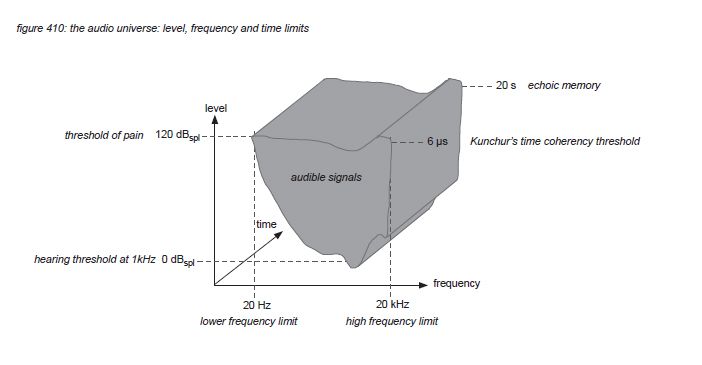
Using the ISO226 loudness contour hearing thresholds, the 120dBSPL pain threshold, Kunchur’s 6 microsecond time coherence threshold and Sperling’s echoic memory limit of 20 seconds, we propose to define the level, frequency and time limits of the human auditory system to lie within the gray area in figure 410:
4.3 Auditory functions
The adult human brain consists of approximately one hundred billion (10 to the 11th power) brain cells called neurons, capable of transmitting and receiving bio-electrical signals to each other(*4M). Each neuron has connections with thousands of other nearby neurons through short connections (dendrites). Some neurons connect to other neurons or cells through an additional long connection (axon). With an estimated 5 hundred trillion(5 x 10 to the 14th power) connections, the human brain contains massive bio-electrical processing power to manage the human body processes, memory and ‘thinking’.
All connections between sensory organs (eg. ears, eyes) and motor organs (eg. muscles) use axons from a dedicated ‘multiconnector’ section of the brain: the brain stem. After processing incoming information, the brain stem sends the information further to other sections of the brain dedicated to specific processes. Audio information is sent to the ‘auditory cortex’.
The brainstem receives data streams from both ears in the form of firing patterns that include information about the incoming audio signals. First, the brainstem feeds back commands to the middle ear muscles and the inner ear’s outer hair cells to optimise hearing in real time. Although this is a subconscious process in the brainstem, it is assumed that the feedback is optimized through learning; individual listeners can train the physical part of their hearing capabilities.

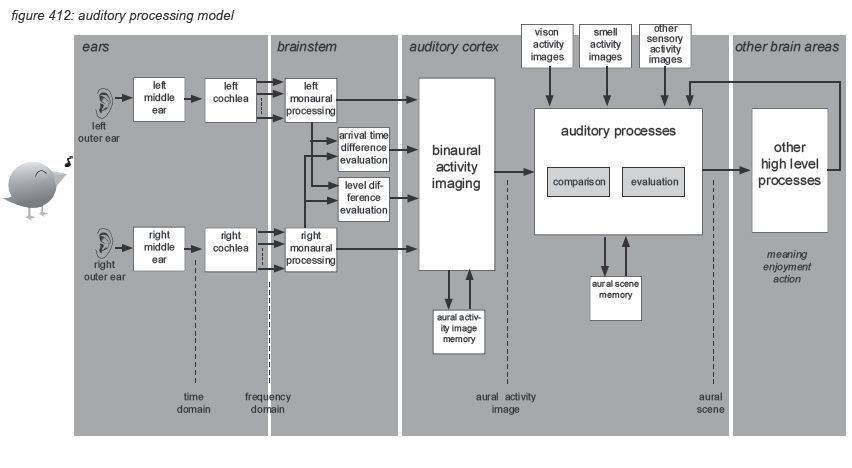
But then the real processing power of the brain kicks in. Rather than interpreting, storing and recalling each of the billions of nerve impulses transmitted by our ears to our brain every day, dedicated parts of the brain - the brain stem and the auditory cortex - interpret the incoming information and convert it into hearing sensations that can be enjoyed and stored as information units with a higher abstraction than the original incoming information: aural activity images and aural scenes. To illustrate this, we propose to use a simplified auditory processing model as shown in figure 412 on the next page(*4N).
The model describes how the incoming audio signal is sent by the ears to the brainstem in two information streams: one from the left ear and one from the right ear. The information streams are received by the brainstem in the frequency domain with individual level envelopes for each of the 3,500 incoming frequency bands - represented by nerve impulse timing and density. The information is sent to the auditory cortex, grouping the spectrum into 24 ‘critical band rates’ called Barks (after Barkhausen(*4O)) to be analysed to generate aural activity images including level, pitch, timbre and localisation. The localisation information in the aural activity image is extracted from both level differences (for high frequencies) and arrival time differences (for low frequencies) between the two information streams. The aural activity image represents the information contained in the nerve impulses as a more aggregated and compressed package of real-time information that is compact enough to be stored in short term memory (echoic memory), which can be up to 20 seconds long.
Comparing the aural activity images with previously stored images, other sensory images (eg. vision, smell, taste, touch, balance) and overall context, a further aggregated and compressed aural scene is created to represent the meaning of the hearing sensation. The aural scene is constructed using efficiency mechanisms - selecting only the relevant information in the auditory action image, and correction mechanisms - filling in gaps and repairing distortions in the auditory activity images.
The aural scene is made available to the other processes in the brain - including thought processes such audio quality assessment.
The processing in the auditory cortex converts the raw audio data into more aggregated images: short term aural activity images containing the characteristics of the hearing sensation in detail, and more aggregated aural scenes representing the meaning of the hearing sensation. The science of describing, measuring and classifying the creation of hearing sensations by the human auditory cortex is the area of psycho-acoustics. In this paragraph we will very briefly describe the four main psycho-acoustic parameters of audio characteristics perception: loudness, pitch, timbre and localization. Also some particular issues such as masking, acoustic environment and visual environment are presented. Note that this chapter is only a very rough and by no means complete summary of the subject, for further details we recommend further reading of the literature listed in appendix.

Loudness
In psycho-acoustics, loudness is not the acoustic sound pressure level of an audio signal, but the individually perceived level of the hearing sensation. To allow comparison and analysis of loudness in the pshysical world (sound pressure level) and the psycho-acoustic world, Barkhausen defined loudness level as the sound pressure level of a 1kHz tone that is perceived just as loud as the audio signal. The unit is called ‘phon’. The best known visualization is the ISO226:2003 graph presented in chapter 4.2 which represents average human loudness perception in quiet for single tones.
Masking
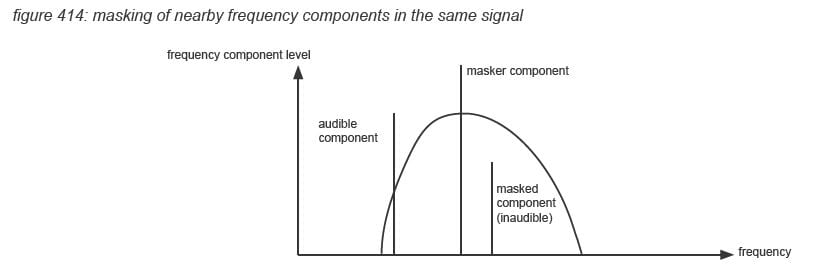
The loudness level of individual frequency components in an audio signal however is also strongly influenced by the shape (duration) of the frequency component’s level envelope, and by other frequency components in the audio signal. The auditory cortex processing leads to an as efficient as possible result, picking up only the most relevant characteristics of the incoming signal. This means that some characteristics of the incoming signal will be aggregated or ignored - this is called masking. Temporal masking occurs where audio signals within a certain time frame are aggregated or ignored. Frequency masking occurs when an audio signal includes low level frequency components within a certain frequency range of a high level frequency component(*4P). Clinical tests have shown that the detection threshold of lower level frequency components can be reduced by up to 50dB, with the masking area narrowing with higher frequencies of the masker component. Masking is used by audio compression algorithms such as MP3 with the same goal as the auditory cortex: to use memory as efficient as possible.
Pitch
In psycho-acoustics, pitch is the perceived frequency of the content of an audio signal. If an audio signal is a summary of multiple audio signals from sound sources with individual pitches, the auditory cortex has the unique ability to decompose them to individual aural images, each with their own pitch (and loudness, timbre and localization). Psycho-acoustic pitch is not the same as the frequency of a signal component, as pitch perception is influenced by frequency in a non-linear way. Pitch is also influenced by the signal level and by other signal components in the signal. The unit mel (as in ‘melody’) was introduced to represent pitch ratio perception invoked by frequency ratios in the physical world. Of course in music, pitch is often represented by notes with the ‘central A’ at 440Hz.
Timbre
‘Timbre’ is basically a basket of phenomenon that are not part of the three other main parameters (loudness, pitch, localization). It includes the spectral composition details of the audio signal, often named ‘sound colour’, eg. ‘warm sound’ to describe high energy in a signal’s low-mid frequency content. Apart from the spectral composition, a sharpness(*4Q) sensation is invoked if spectral energy concentrates in a spectral envelope (bandwidth) within one critical band. The effect is independent from the spectral fine structure of the audio signal. The unit of sharpness is acum, which is latin for ‘sharp’.
Apart from the spectral composition, the auditory cortex processes are very sensitive to modulation of frequency components - either in frequency (FM) or amplitude (AM). For modulation frequencies below 15 Hz the sensation is called fluctuation, with a maximum effect at 4Hz. Fluctuation can be a positive attribute of an audio signal - eg ‘tremolo’ and ‘vibrato’ in music. Above 300Hz, multiple frequencies are perceived - in case of amplitude modulation three: the original, the sum and the difference frequencies. In the area between 15Hz and 300Hz the effect is called roughness(*4R), with the unit asper - Latin for rough. The amount of roughness is determined by the modulation depth, becoming audible only at relatively high depths.

Localisation
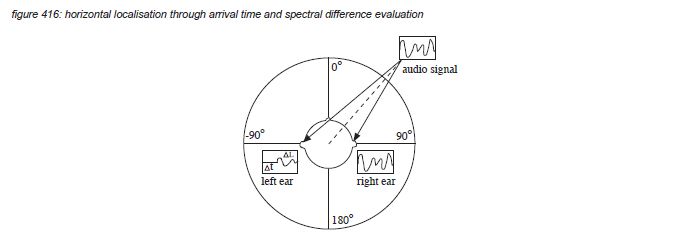
For an average human being, the ears are situated on either side of the head, with the outside of the ear shells (pinnae) approximately 21 centimetres apart. With a speed of sound of 340 meter per second, this distance constitutes a time delay difference for signals arriving from positions at the far left or right of the head (90-degree or -90-degree in figure 413) of plus and minus 618 microseconds - well above the Kunchur limit of 6 microseconds. Signals arriving from sources located in front of the head (0-degree angle) arrive perfectly in time. The brain uses the time difference between the left ear and the right ear information to evaluate the horizontal position of the sound source.
The detection of Interaural Time Differences (or ITD’s) uses frequency components up to 1,500 Hz - as for higher frequencies the phase between continuous waveforms becomes ambiguous. For high frequencies, another clue is used by the auditory cortex: the acoustic shadow of the head, causing attenuation of the high frequency components of signals coming from the other side (Interaural Level Difference or ILD).
Because the two ears provide two references in the horizontal plane, auditory localisation detects the horizontal position of the sound source from 90-degree or -90-degree with a maximum accuracy of approximately 1-degree (which corresponds to approximately 10 μs - close to the Kunchur limit). For vertical localisation and for front/rear detection, both ears provide almost the same clue, making it difficult to detect differences without prior knowledge of the sound source characteristics. To provide a clear second reference for vertical localisation and front/rear detection, the head has to be moved a little from time to time(*4S).
Temporal masking
An example of temporal masking is the Haas effect(*4T). The brain spends significant processing power to the evaluation of time arrival differences between the two ears. This focus is so strong that identical audio signals following shortly after an already localised signal are perceived as one audio event - even if the following signal has an amplitude of up to 10dB more than the first signal. With the second signal delayed up to 30 milliseconds, the two signals are perceived as one event, localized at the position of the first signal. The perceived width however increases with the relative position, delay and level of the second signal. The second signal is perceived as a separate event if the delay is more than 30 milliseconds.
For performances where localisation plays an important role, this effect can be used to offer a better localisation when large scale PA systems are used. The main PA system is then used to provide a high sound pressure level to the audience, with smaller loudspeakers spread over the stage providing the localisation information. For such a system to function properly, the localisation loudspeakers wave fronts have to arrive at the audience between 5 and 30 milliseconds before the main PA system’s wave front.

Acoustic environment
The hearing sensation invoked by an audio signal emitted by a sound source is significantly influenced by the acoustic environment, in case of music and speech most often a hall or a room. First, after a few milliseconds, the room’s first early reflections reach the ear, amplifying the perceived volume but not disturbing the localization too much (Haas effect). The reflections arriving at the ear between 20 ms and 150 ms mostly come from the side surfaces of the room, creating an additional ‘envelopment’ sound field that is perceived as the representation of the acoustic environment of the sound source. Reflections later than 150 ms have been reflected many times in a room, causing them to lose localization information, but still containing spectral information correlating with the original signal for a long time after the signal stops. The reverberation signal is perceived as a separate phenomenon, filling in gaps between signals. Long reverberation sounds pleasant with the appropriate music, but at the same time deteriorates the intelligibility of speech. A new development in electro-acoustics is the introduction of digital Acoustic Enhancement Systems such as Yamaha AFC, E-Acoustics LARES and Meyer Constellation to enhance or introduce variability of the reverberation in theatres and multi-purpose concert halls(*4U).
Visual environment
Visual inputs are known to affect the human auditory system’s processing of aural inputs - the interpretation of aural information is often adjusted to match with visual information. Sometimes visual information even replaces aural information - for instance when speech recognition processes are involved. An example is the McGurk- Mcdonald effect, describing how the word ‘Ba’ can be preceived as ‘Da’ or even ‘Ga’ when the sound is dubbed to a film of a person’s head pronouncing the word ‘Ga’(*4V). With live music, audio and visual content are of equal importance to entertain the audience - with similar amounts of money spent on audio and light and video equipment. For sound engineers, the way devices and user interfaces look have a significant influence on the appreciation - even if the provided DSP algorithms are identical. Listening sessions conducted ‘sighted’ instead of ‘blind’ have been proven to produce incorrect results.

